Using the Signals Page
Overview
Think of Bolster AI Signals as your single pane of glass for brand risk. Instead of switching between tabs or wondering where to find key data, you can get just-in-time answers about your brand’s exposure and even compare your results to industry and global benchmarks.
Signals provides a consolidated view of external threat and fraud metrics within the Bolster platform. It helps security teams monitor URL scans, takedowns, and threat patterns, all in one place, with an intuitive chatbot-style interface for data exploration.
To access the Signals page on the Bolster platform, select Signals in the top navigation bar.
Here’s how to use the Signals page to help your team move faster, reduce risk, and communicate results more effectively.

Top Four Insights
Powered by advanced LLMs, the top section of the Signals page displays concise summaries of the four most relevant findings for your brand right now. Review these to learn your highest priority areas of risk and opportunity.
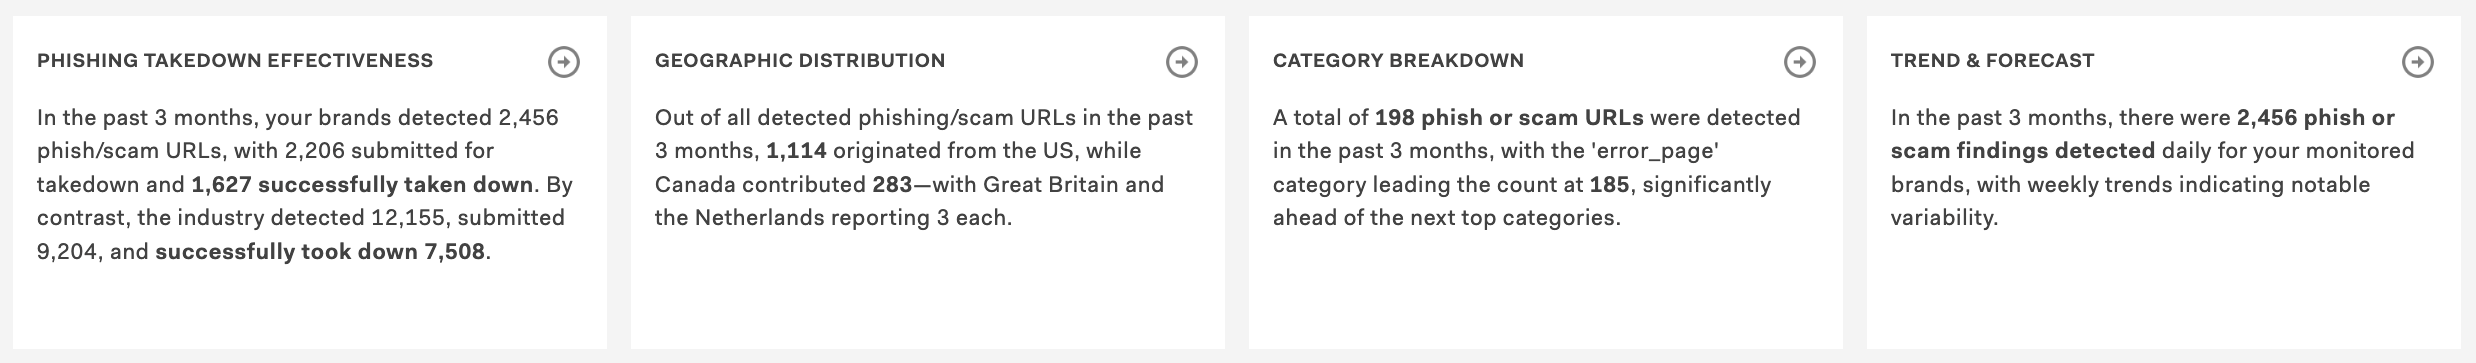
Topics include takedown effectiveness, geographic distribution, trends and forecasts, and others. These summaries draw on data from the last three months and are refreshed daily.
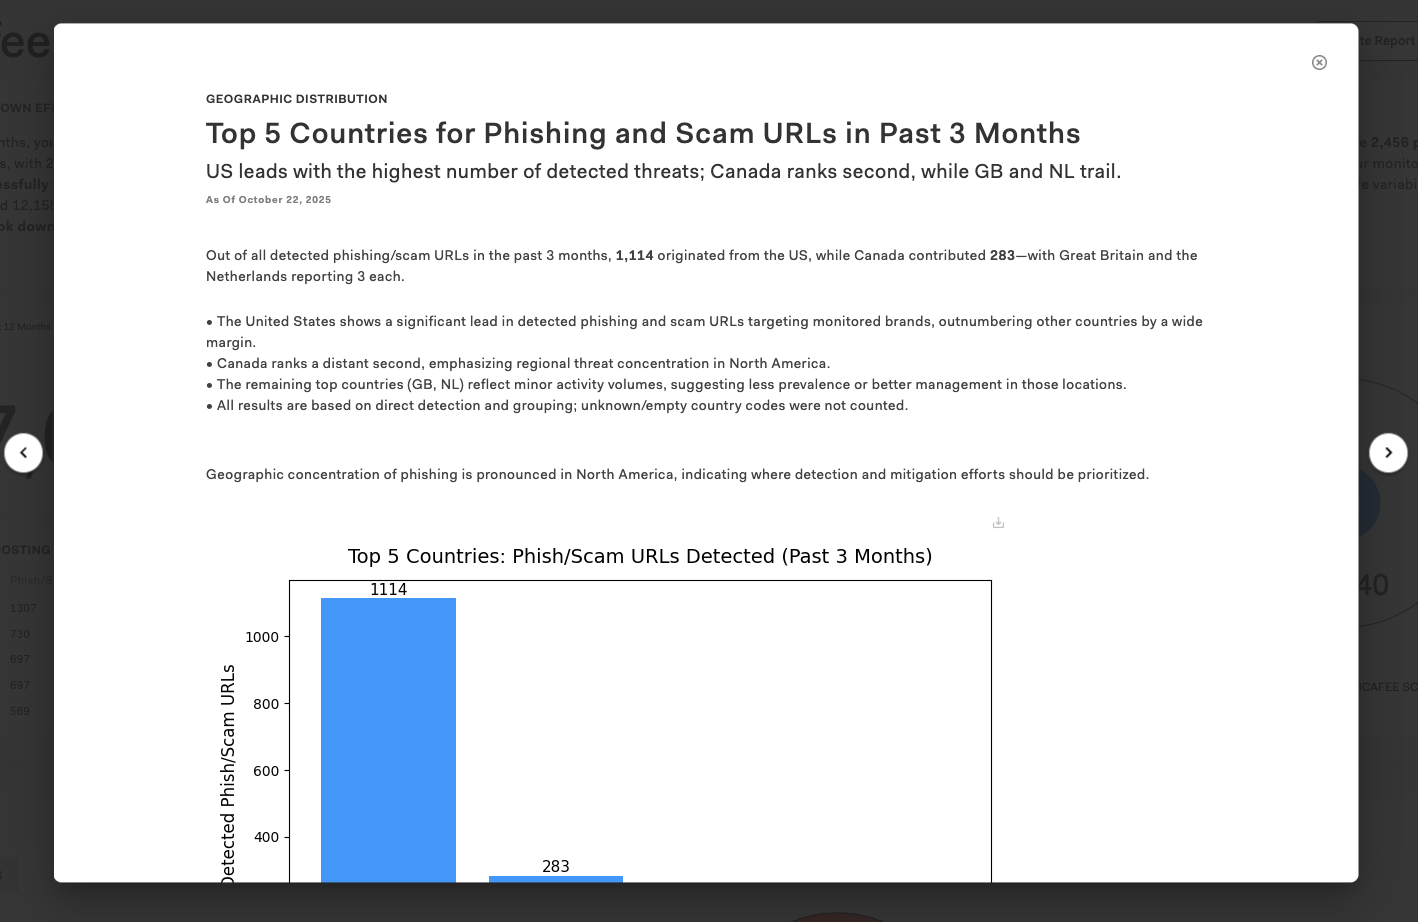
Click in the upper right corner of each insight to see a detailed explanation and a downloadable visualization.
Data Widgets
Each widget on the Signals page surfaces a different layer of intelligence:
- Takedowns – Total takedowns and median response time for the selected date range.
- All Scans – Total count of scans where your brand was identified, including scans run by Bolster and by your team.
- Threat Actor Hosting Patterns – Top hosting providers used by threat actors, total phishing URLs found, and median takedown time per provider.
- Malicious URLs Over Time – Your brand’s data against industry and global baselines.
Use the drop-down selectors on each widget to view activity across specific date ranges, such as the last 30 days, the last 12 months, or a custom range.
Scans and Actions
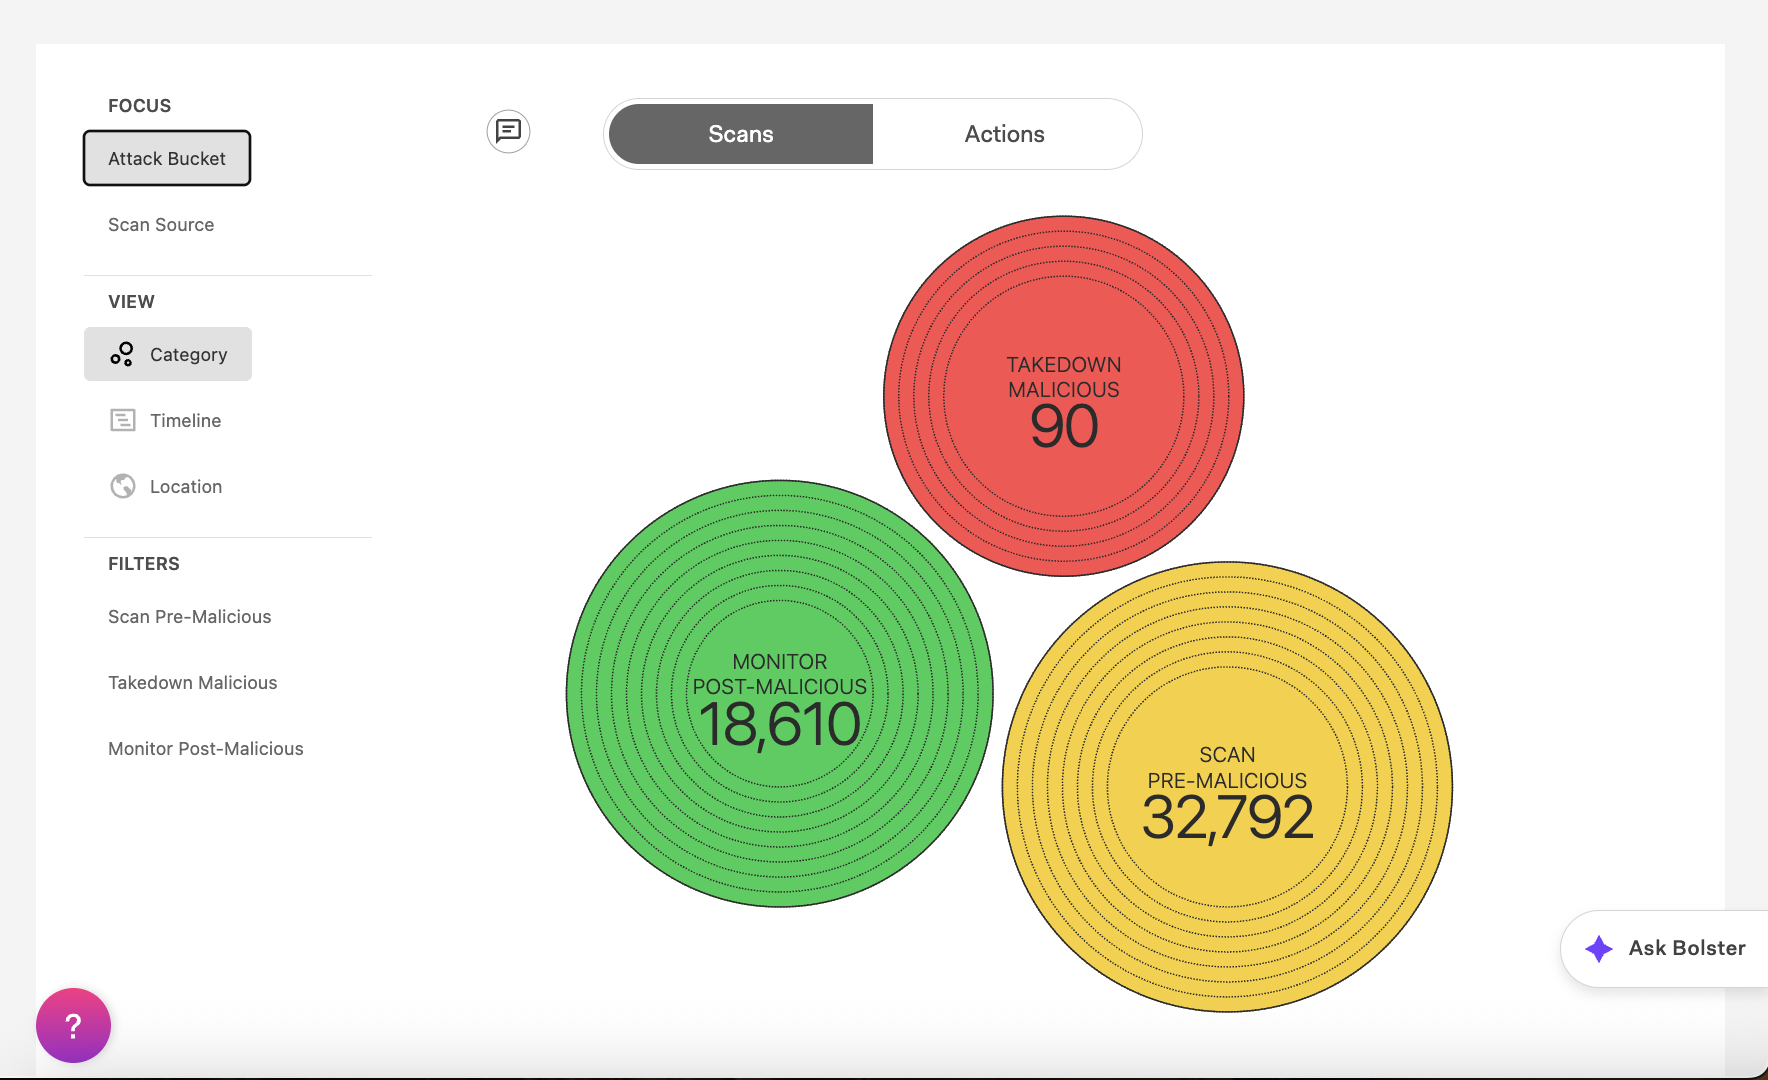
Select Scans to analyze trends with detailed scan data. Hover over the circles to drill down, and use filters such as:
- Attack Bucket / Scan Source – See scans by overall type of attack or by category.
- Category – Identify scan type (spam, passive DNS, etc.).
- Timeline – Track scan volume and detections across dates.
- Location – Map threat activity geographically by IP address.
In the list view, use filters such as First Detected, Last Seen, Country, and Current Disposition to refine.
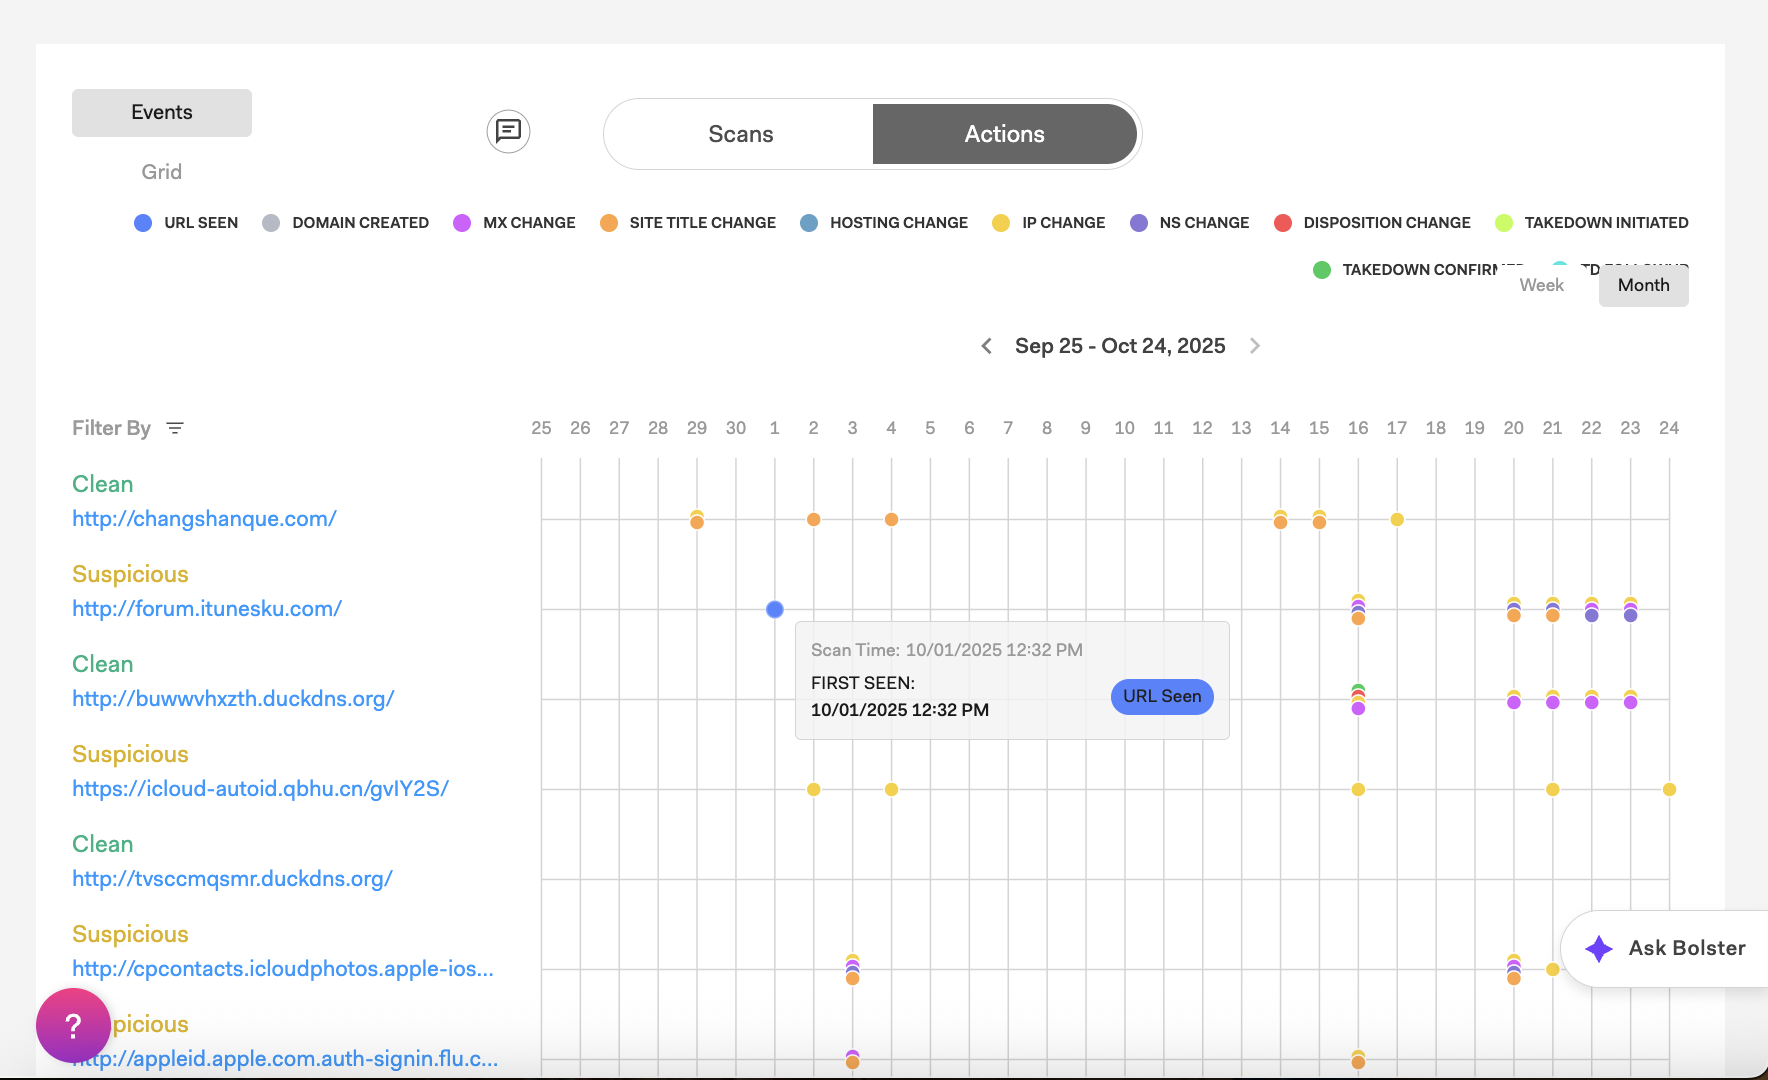
Select Actions for timeline and grid views of detected threats and takedown-related events. The visual timeline shows the lifecycle of a malicious URL, from when it’s first seen to when it’s taken down, helping you understand how threat actors reuse the same infrastructure to evade takedowns and commit fraud.
Each event (URL Seen, Domain Created, etc.) represents a timestamp in that lifecycle. Select or clear an event type to show or hide it from the timeline, and hover over any event point for more details.
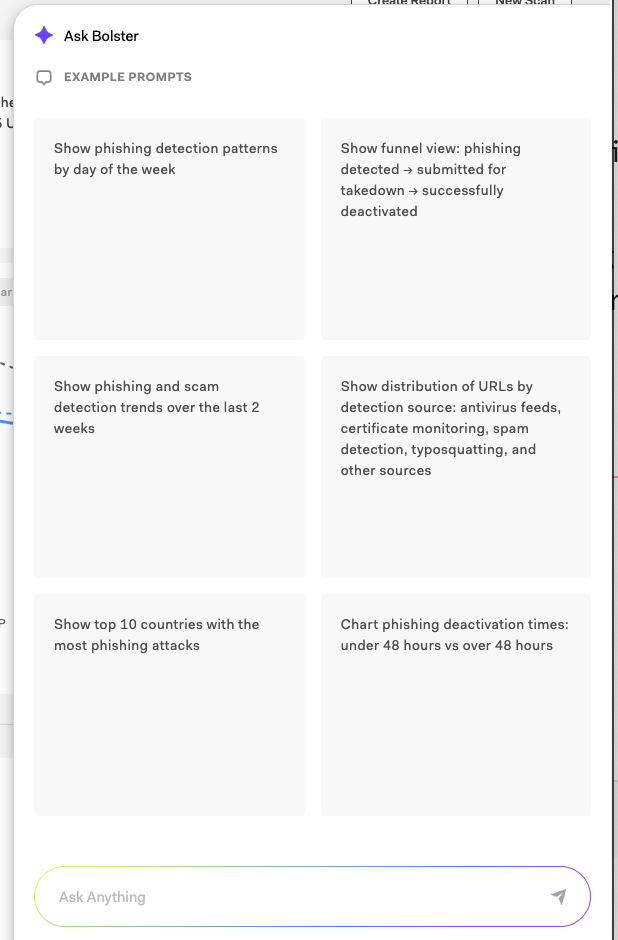
AI Assistant
Select Ask Bolster in the lower-right corner to open the AI assistant. Explore the data conversationally to gain insights that would otherwise be difficult to compile. Click on one of the example prompts as an optional starting point.
You can ask open-ended questions in plain language. Analyze fraud activity, threat trends, and performance benchmarks. Ask follow-up questions and request downloadable visualizations.

More Tasks Available
From the Signals page, teams can also perform these additional tasks:
- Create reports – Select Create Report to generate a summary of Signals data for a selected date range. Download the report as a PDF or PPT to share.
- Start or review URL scans – Select New Scan to go directly to Bolster’s URL Scan feature. Perform a new scan or review past results.
- Investigate via table view – Dive deeper by viewing individual findings in a filterable table with direct links to each URL’s Insights page.
Reporting and scanning options are built into the Signals page for quick access.